Volatility is one of the most popular memory analyzer. This tools can help every digital forensic investigators to inspect a volatile memory dump from an infected computer. During this exercise, we will use this tool to find several flags.
Flag 1 : Find the running rogue (malicious) process. The flag is the MD5 hash of its PID.
Flag 2 : Find the running rogue (malicious) process and dump its memory to disk. You'll find the 32-character flag within that process's memory.
Flag 3 : What is the MAC address of this machine's default gateway? The flag is the MD5 hash of that MAC address in uppercase with dashes (-) as delimiters. Example: 01-00-A4-FB-AF-C2.
Flag 4 : Find the full path of the browser cache created when an analyst visited "www.13cubed.com." The path will begin with "Users\." Convert the path to uppercase. The flag is the MD5 hash of that string.
Memory file can be found in https://drive.google.com/drive/folders/1E-i2RTUBXBGUd_Xz0k67kFOpHcr6WX8J?usp=sharing
Find the running rogue (malicious) process. The flag is the MD5 hash of its PID
Using Volatility v2.6.1, the first thing to check is the system profil. We want to know to have more information regarding the memory dump.
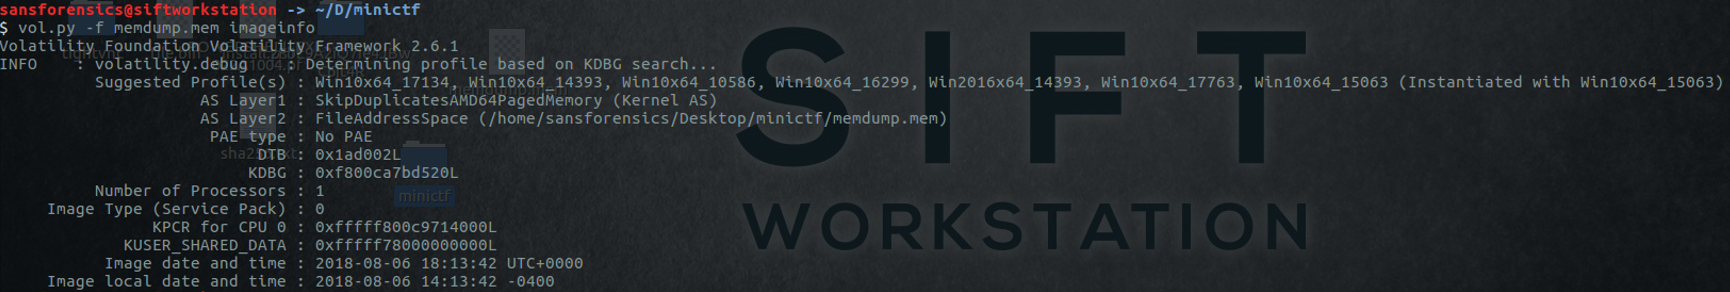 That Volatility command is showing us that the operating system used in the memorydump is a Windows 10 v.17134. Let's list the process running during the memory dump.
 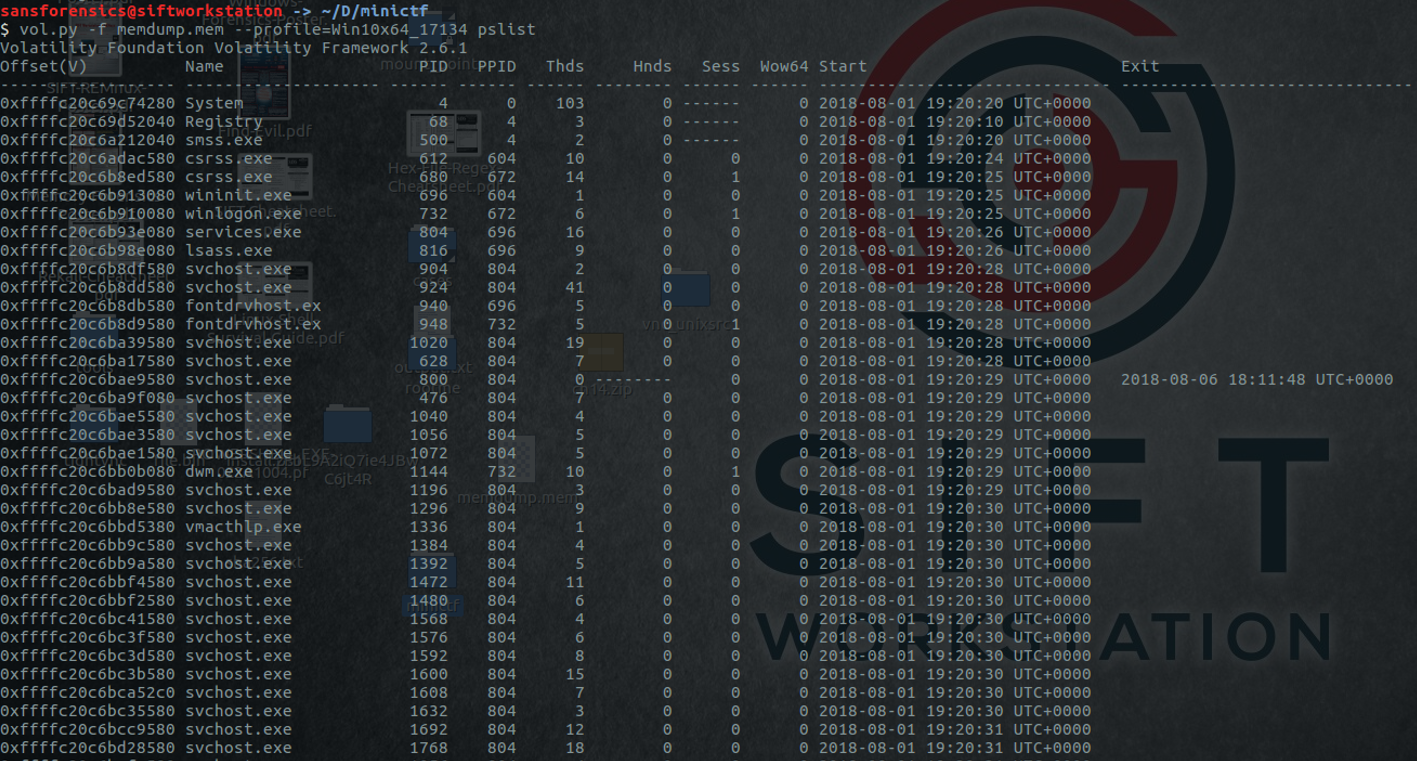 The command "pstree" lists the process running but give a better view by also showing the parent process.
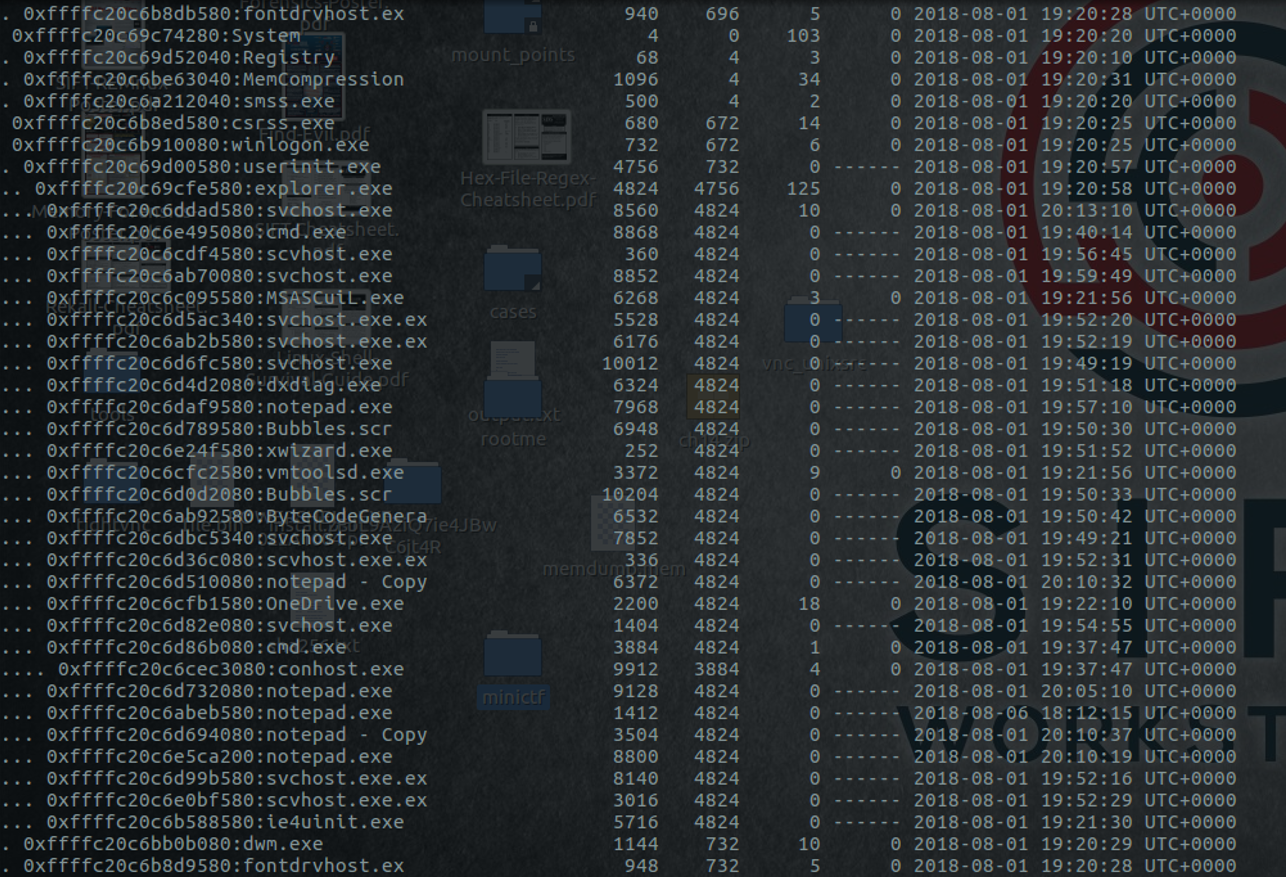 Some svchost.exe processes have explorer.exe as parent process, some are also called "svchost.exe.ex" which are, in both cases, very suspicious.
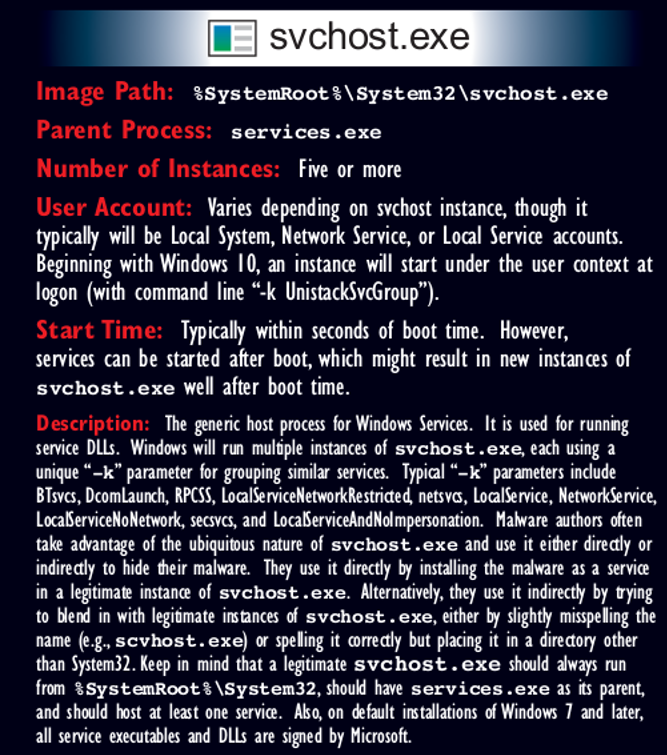
 According to Find Evil.pdf from SANS DFIR, svchost.exe should always run from %SystemRoot%\System32, should always have services.exe as its parent and should host at least one service.
 Psxview, contrary to pslist or pstree can list hidden processes. It can be useful to see if some processes are hidden and cannot be found with pslist or pstree. Psscan allows us to find if the process has ended or is still running during the memory dump. Both tools are excellent tools to get more information on running processes.
 The PID of the process "explorer.exe" is 4824, to get all the PID of the svchost as child process of explorer.exe, we can filter on the PID 4824 and the process name "svchost".
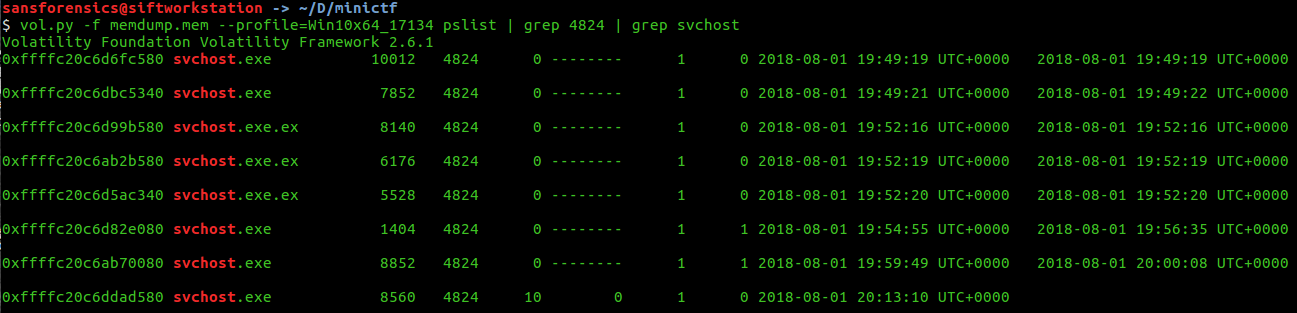 Looking at pslist, the process ID 8560 is the only process having threads, which means that the process is currently still running during the memory dump. Moreover, there is not terminated time
Explorer.exe is the process managing the Windows start menu, taskbar, desktop and file explorer. Windows also use explorer.exe to start process, all programs started by the user running in the user desktop are explorer's children process. Let's look at system command line to see if we can find out how the process has been called.
Looking at pslist, the process ID 8560 is the only process having threads, which means that the process is currently still running during the memory dump. Moreover, there is not terminated time
Explorer.exe is the process managing the Windows start menu, taskbar, desktop and file explorer. Windows also use explorer.exe to start process, all programs started by the user running in the user desktop are explorer's children process. Let's look at system command line to see if we can find out how the process has been called.
Volatility Foundation Volatility Framework 2.6.1
svchost.exe pid: 8560
Command line : "C:\Windows\svchost.exe"
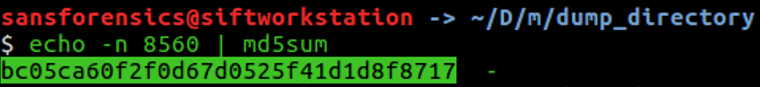
The flag is the MD5 hash of the running malicious PID.
Find the running rogue (malicious) process and dump its memory to disk. You'll find the 32-character flag within that process's memory
To dump the memory of a process, use the command memdump in Volatility.
The flag is inside of the process's memory, let's check the strings.
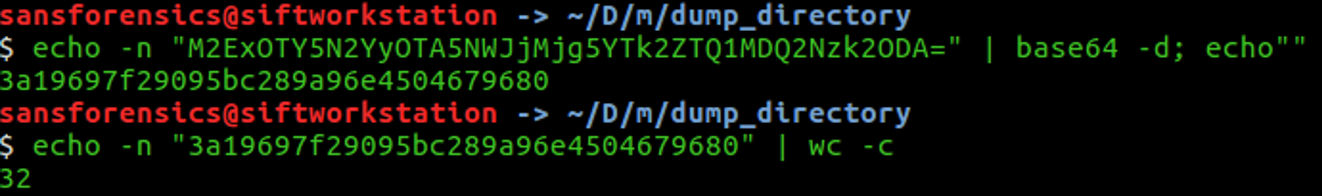
 However, the number of characters is not 32.
44
What is the MAC address of this machine's default gateway? The flag is the MD5 hash of that MAC address in uppercase with dashes (-) as delimiters. Example: 01-00-A4-FB-AF-C2
To find the MAC address of a system, we can dump the registry of the system from volatility.
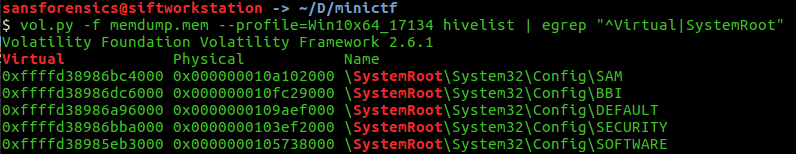
Most of the supporting files for the hives are in the %SystemRoot%\System32\Config directory.
Let's use the command hivelist to print the registry hives of the system.
 Windows register is a database regarding the system configuration, we can find the information about network configuration in HKLM\SOFTWARE\Microsoft\Windows NT\CurrentVersion\ NetworkList\Signatures\Unmanaged.
 The registry key storing the MAC address of the default gateway is DefaultGatewayMac To display the registry key, we can use the command printkey
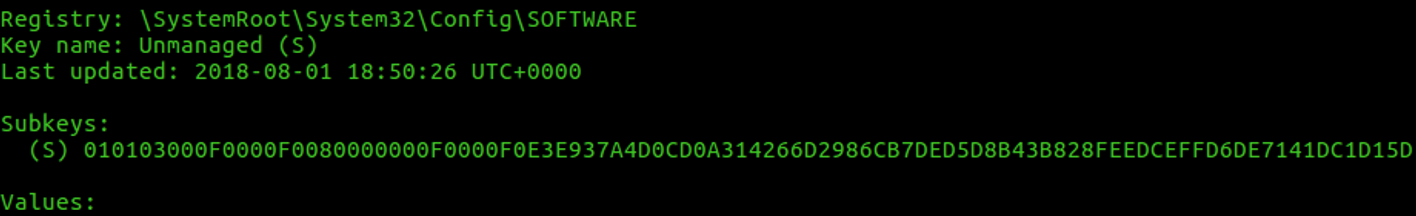 The subkey contained in that registry key is the identity of the unmanaged. Let's check that subkey to see if we have the subkey "DefaultGatewayMac".
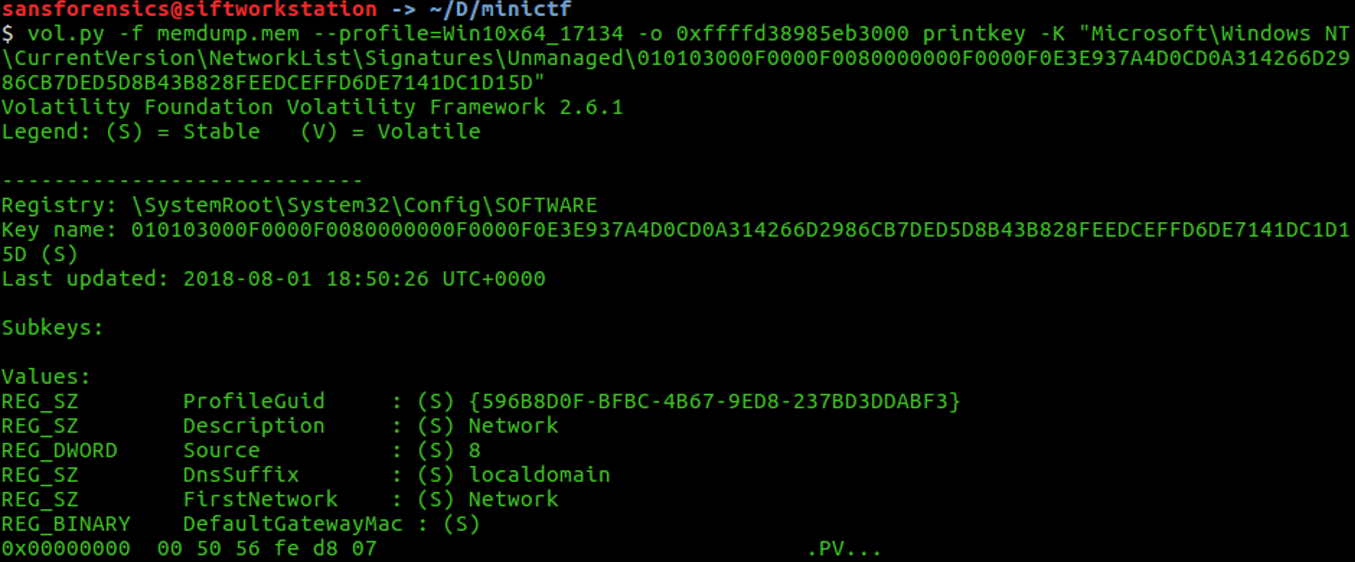 DefaultGatewayMac : 00 50 56 fe d8 07
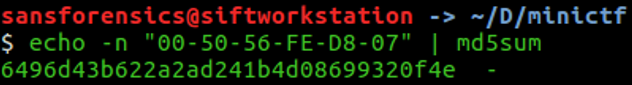
The third flag is the MD5 of the MAC address in upper case with dash (-), let’s find the md5 of 00-50-56-FE-D8-07:
DefaultGatewayMac : 00 50 56 fe d8 07
The third flag is the MD5 of the MAC address in upper case with dash (-), let’s find the md5 of 00-50-56-FE-D8-07:
Find the full path of the browser cache created when an analyst visited "www.13cubed.com." The path will begin with "Users\." Convert the path to uppercase. The flag is the MD5 hash of that string
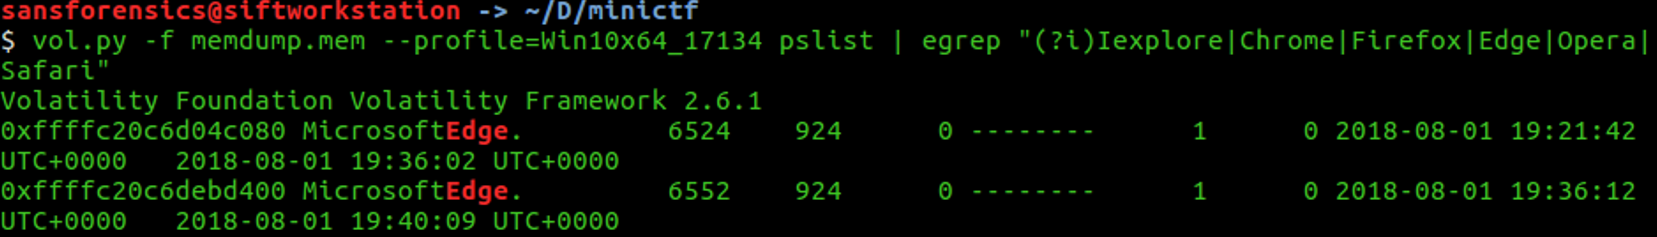
On this one, we will see how to scan for internet cache and history using volatility. Let us first check the process list again of the memory file, to see if there are any browser instances.
Browser that we know: Internet Explorer, Google Chrome, Mozilla Firefox, Microsoft Edge, Opera, Safari
 Let's attempt with the yarascan plugging to get something regarding the file history and cache of the process Microsoft Edge.
The NTFS file system contains a file called the master file table, or MFT. There is at least one entry in the MFT for every file on an NTFS file system volume, including the MFT itself. All information about a file, including its size, time and date stamps, permissions, and data content, is stored either in MFT entries, or in space outside the MFT that is described by MFT entries.
Since that the MFT has the list of all the files and folders on disk, we might retrieve some file located on the disk of the system by using the plugging MTFparser on volatility.
Let's filter on "13cubed" to see if we have any result.
 An HTM file is an HTML webpage used by browsers such as Google Chrome, Microsoft Edge, Mozilla Firefox...
To get the flag, we must convert it in uppercase, we can use python with the function upper() to convert any string in uppercase string.
 And finally, use the command md5sum to calculate the MD5 of that path to get the fourth flag.
